Getting Started
Vizier organizes data curation workflows into projects.
- Start by selecting or creating a new project under the Projects Tab.
- If the data that you want to clean is currently stored in CSV files, these files have to be uploaded to the file server. You can upload your data files under the Files Tab.
Step 1
Create Project

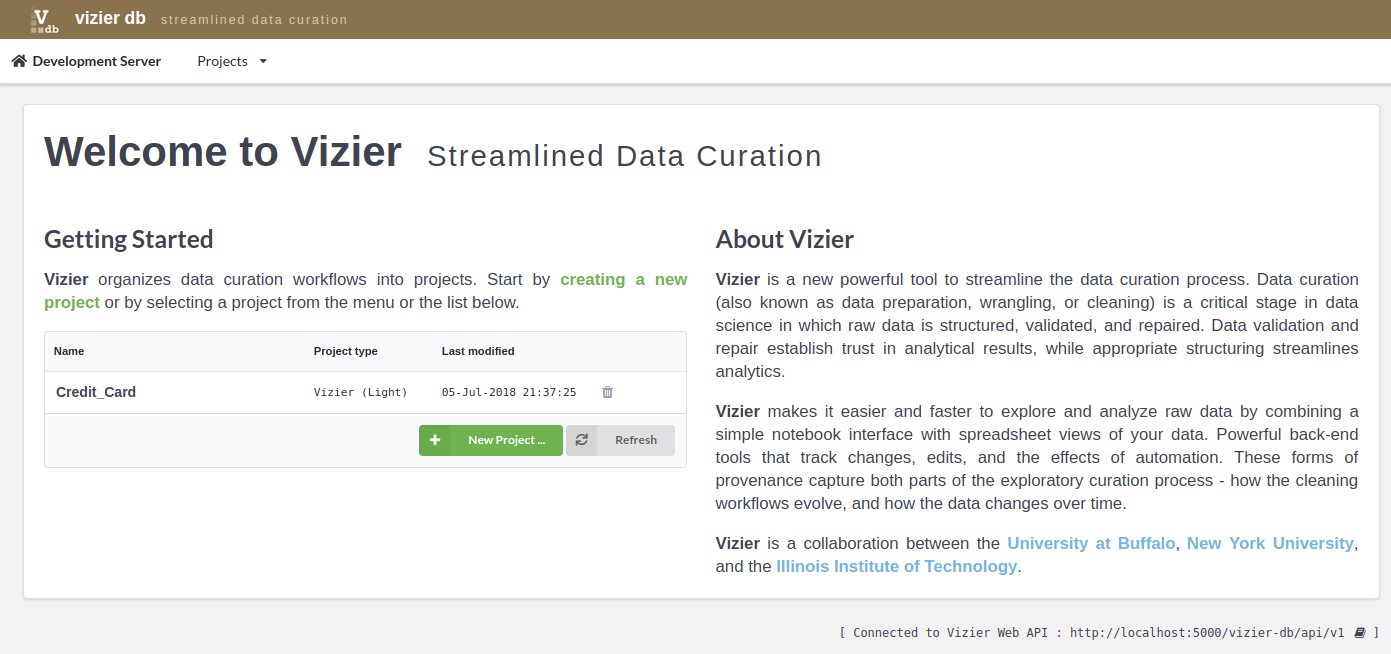
Begin by adding a project on the Vizier page (initial page), shown in the figure above, by clicking on the New Projects … button.

On the New Project… dialog shown in figure above, enter the name of the project you would like to create, for example credit_card, and click on Submit button. You should now see the new project you added in the list of projects as shown below.
Once project is added click on project name in the list of projects to data curation.
Step 2
Load Dataset
Continuing with our example of the Credit_Card project, we show here the methods of uploading data.
First, select one project from the list of projects, for example, credit_card project by clicking on the name project.

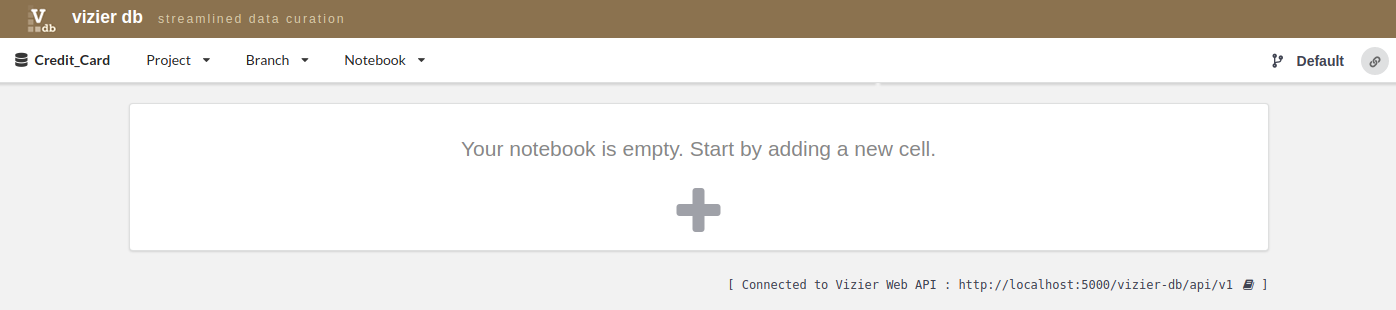
Once you are inside the project, load the data by clicking in the sign +.
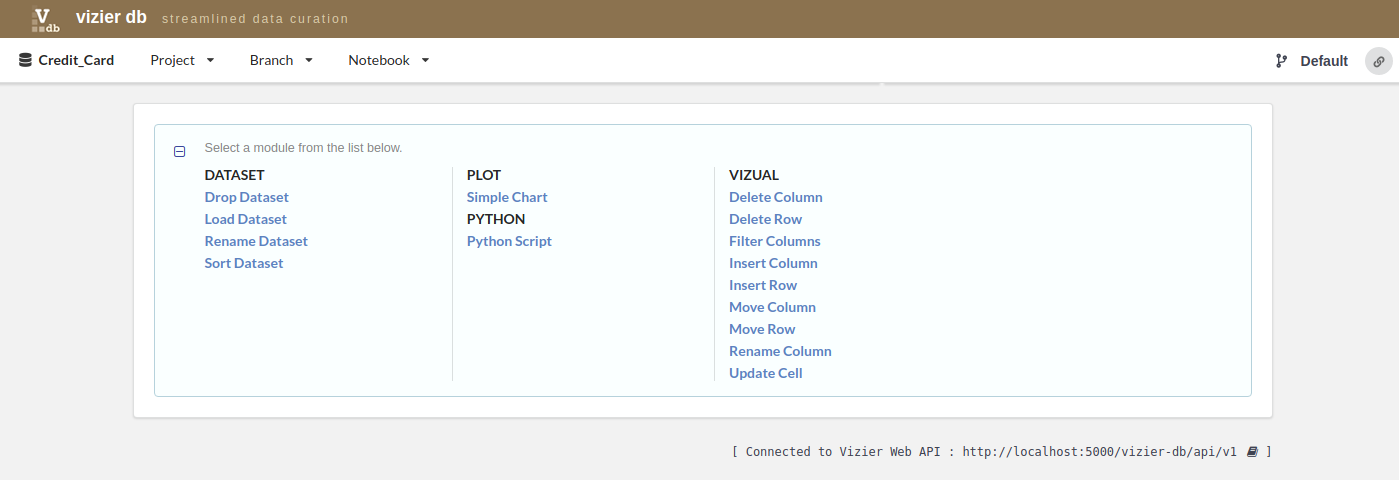
Then, go to the column DATASET, and click on Load Dataset
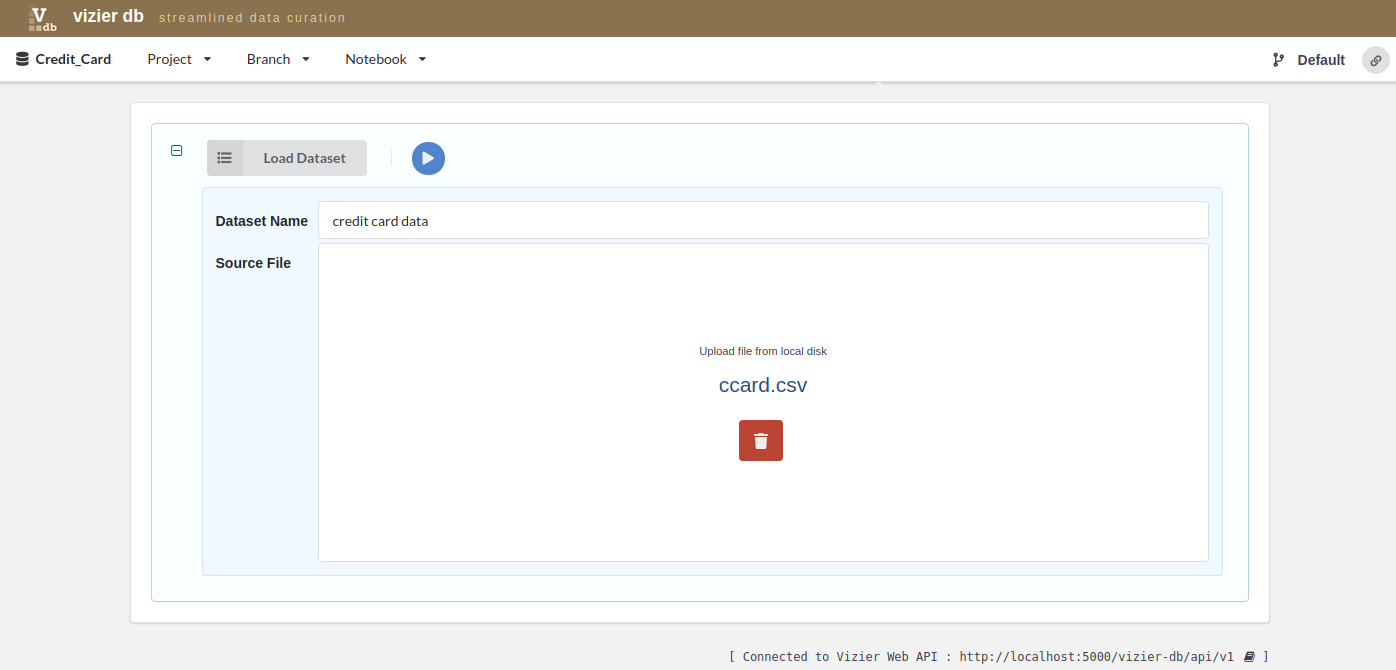
Then, upload the data set. You have to provide the data set name and the source file.

For example, we entered credit card data as the name of the dataset for that project and selected ccard.csv dataset, then, click on the blue play icon.
After loading the credit card dataset, we can start to explore and curate our data.

Step 3
Spreadsheet Views
Vizier makes it easier and faster to explore and analyze raw data by combining a simple notebook interface with spreadsheet views of your data. Powerful back-end tools that track changes, edits, and the effects of automation. These forms of provenance capture both parts of the exploratory curation process - how the cleaning workflows evolve, and how the data changes over time. To access the spreadsheet of our Credit Card project just go under the Credit Card Data Tab.

Step 4
Chart Views
Vizier provides five types of chart: Simple bar chart, group bar chart, line chart, area chart and scatter plot. To create a chart, user have to select a module Plot>>Simple Chart from the list below.
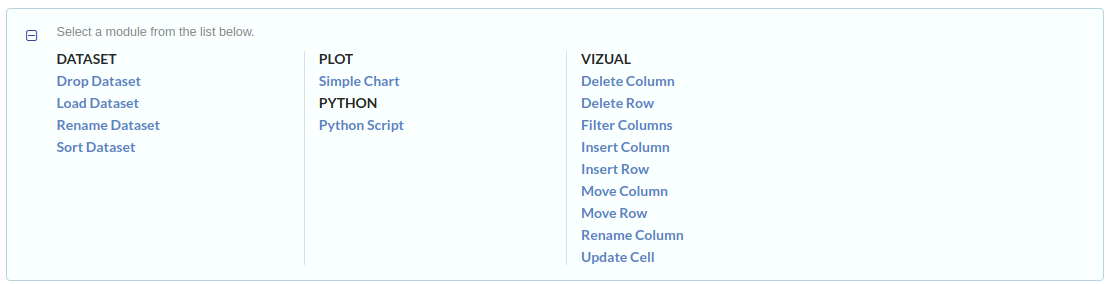
Then, fill the form and click on the blue play icon.
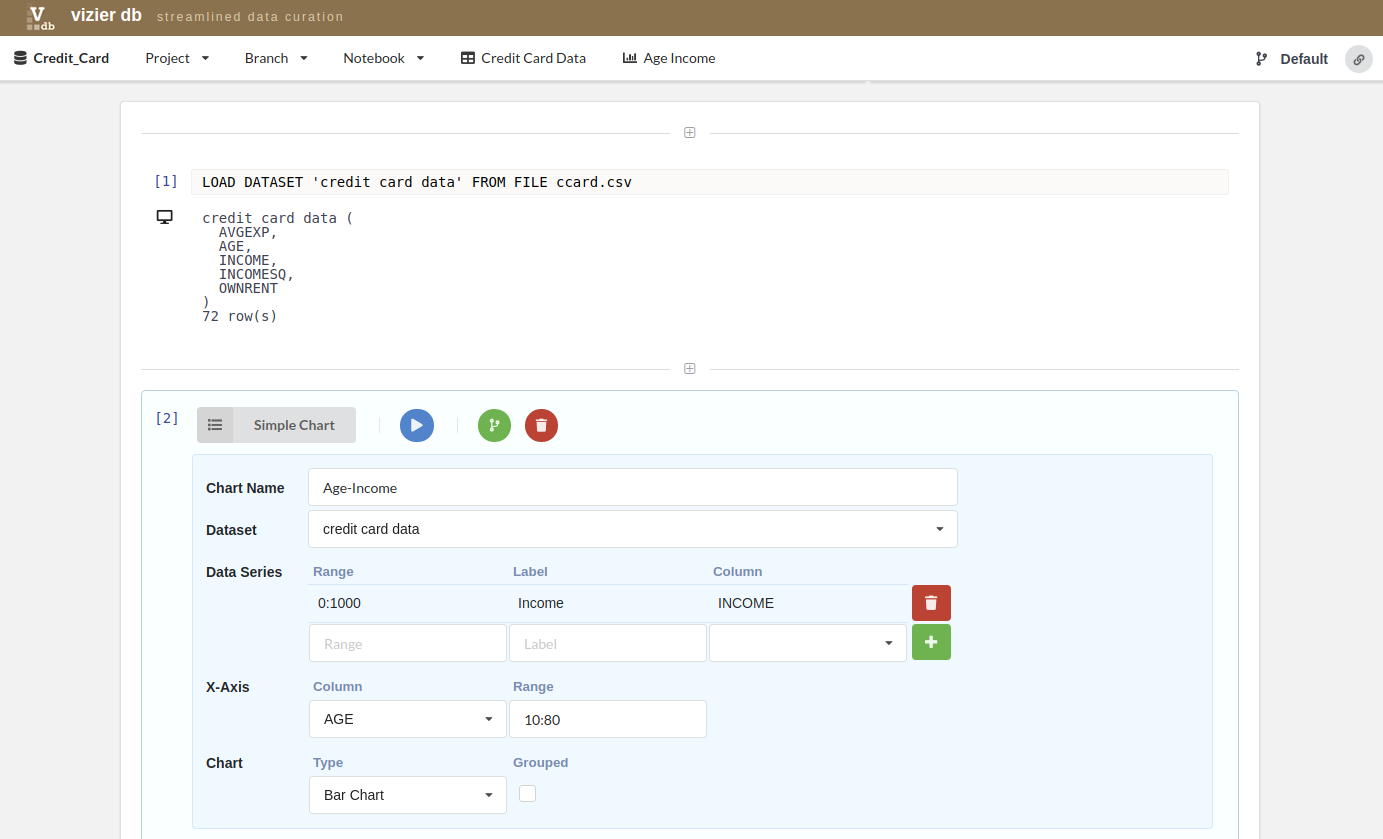
To access the Chart view of our Credit Card project just go under the Age Income Tab which is the name of the chart.
